To assist physical education personnel, administrators, classroom teachers and parents to understand the fitness and skill scores obtained from the 7 item fitness tests and the 10 item skill tests a scoring function – the Physical Quotient (PQ) was developed. The function was designed to derive a score showing the performance of a student, accounting for their age and gender, in relation to the performance of all students and to provide schools with an effective MIS (Managing Information Systems), which is easily understood. The PQ was derived from measuring primary students over a 10 year period and included some 161, 800 data points and 40, 000 students.
This ‘world first’ research with the longest data base currently in world was published in 2015 in the International Research Literature “Advances in Physical Education”, tracing the 30 year journey of commitment to improve physical activity and health.
From this pool a statistically generated weighting was given for each of the fitness and skill tests. The PQ with different weightings was developed for each age and gender from 6 years of age to 17 years of age. Two quotients were developed : a Fitness Quotient (FQ) and a Skill Quotient (SQ).
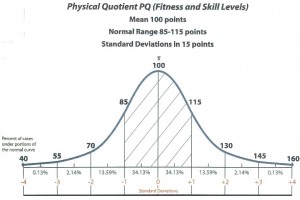
The resultant Fitness Quotient (FQ) and Skill Quotient (SQ) was typically a number in the range of 85 to 115, with a score of 100 representing an average performance in the fitness and skill tests. The scoring is based on, and is statistically equivalent to, the standard IQ tests used for assessment of intellectual capacity and follows the standard Gaussian distribution. A minimum level for children to achieve is 85 points.
The PQ was designed to have a mean score of 100 and a standard deviation of 15 for each age and sex group. A score of 115 represents +1 standard deviations above the population mean in that age and sex group, the student having performed better than 66% of the population. A score of 130, or +2 standard deviations, shows that the student has performed better than 94% of those in the pool. The distribution of PQ scores is approximately normal, with the bulk of scores within -1 and +1 standard deviations of the mean (see figure 2).
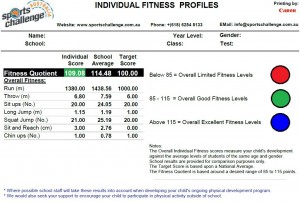
The PQ with its Fitness Quotient (FQ) and Skill Quotient (SQ) scores, became very popular with teachers and parents alike as it gave a scoring mechanism that incorporated all the testing results into one understandable measure. It gave a quick ‘ready reckoner’ of individual, class, gender, and school performance and provided the corner stone to strategically plan a physical education program with genuine ownership from students, teachers and parents (see Parent Report, figure 1).
The PQ was used to compare across the year levels of students and to measure changes over time. It proved to be a useful diagnostics tool, enabling teachers to identify overall poorly performing students and devise appropriate remedial programs in the appropriate areas.
The scores are printed out in a hierarchical order for both fitness and skills. Teachers and parents could immediately see how a student was performing in both fitness and skill against a normal distribution. The PQ scoring will provide an ongoing motivation to ownership of the importance of a physical education and will allow students, teachers and parents to establish the ‘best practice’ in their physical education program to maintain optimum performance over time.
Full Electronic and Hard Copy reports are provided including individual student reports for parents showing a student’s performance compared to the school average for age and gender along with National means for age and gender (see below).
For more information about the Physical Quotient contact the C.E.O of Sports Challenge, Dr Garry Tester.


